Trend analysis and early warning systems to support better prediction
Let us commence by understanding and answering the following questions that are relevant:
1. What exactly is Trend Analysis? – This is a technique used to analyse an entities financial data by collecting information from multiple prior periods and using this information to generate valuable insights, to assist in understanding the past and making data based decisions to change the future.
2. What can Trend Analysis be used for :
a) Measure the profitability positions of an entity over a number of years/months.
b) Analyse and understand the liquidity position.
c) Reviewing the historical sales patterns to understand declines and inclines in revenue.
d) Examining expenses and identifying unusual expenditures in a reporting period.
e) Measurement of employees productivity levels, actuals vs budget.
f) Cash flow forecasting and planning.
g) The above are just a few examples noted but Trend Analysis are not limited and may even be used for monitoring your stock levels and other aspects relevant to your business.
3. One of the fundamental aspects of ensuring a successful business is to ensure that you possess a deep knowledge and understanding of your businesses needs and requirements.
4. Okay now that we have clarified and defined Trend Analysis, let us review the values and benefits it could add to your business:
a) Improving your business by assisting and helping you identify areas within your business that are performing and areas that are not, allowing you the opportunity of making future predictions.
b) Giving you a better understanding of your historical data and allowing you to make data driven decisions with regards to future events.
c) Visuals are more effective, simplifies the numbers and easier to interpret.
Examples of Trend Analysis
Example 1
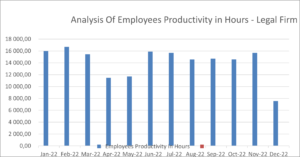
a) The above analysis is based on the productivity levels of total employees on a monthly basis. The total average number of productive hours per month is 16 000.
b) Based on the above information, the number of productive hours in the month of March 2022 reduced to 15 400 hours and a substantial reduction in April and May 2022 to 11 500 hours.
c) Reasons for this decrease could be attributed to a number of reasons, possibly a number employees on sick/ annual leave. Management will have to review and pay special attention to the April and May 2022 periods to try and understand the reasons as this will result in decrease of turnover/ billing and possibility long term incentives and cash flow.
d) December 2022 is another period with an extremely low number of productive hours which amounted to 7 800. In this month, the firm closes around the 15th of the month for the holidays and only resumes in January 2023.
Example 2
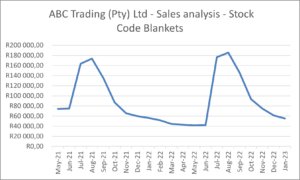
a) The above entity specialises in wholesaling of blankets.
b) Observe how the trend is stagnant in the months of May & June 2021 and thereafter a sharp incline in July and Aug 2021 and then a sudden decline from September 2021 all the way to following year in June 2022 and an incline in July 2022.The reason for this is that due to demand of this specific product been seasonal, there is a substantial demand for it in the winter months which are July & Aug. During the summer periods the demand is less which resulted in a decline.
c) The above trend analysis can be useful by assisting management in decision making, planning purposes for purchases and monitoring inventory.
In summary then the key point about trend analysis is that you should look at key financial ratios for your business to understand patterns and trends. These insights should improve your understanding of your business to assist in making data-based decisions in the future.